
![[Writing Task 1 - Line Graph] Birth rates of China and the USA](https://hrsviet.com/uploads/0000/1/2025/12/27/birth-rates-of-china-and-the-usa.png)
You should spend about 20 minutes on this task.
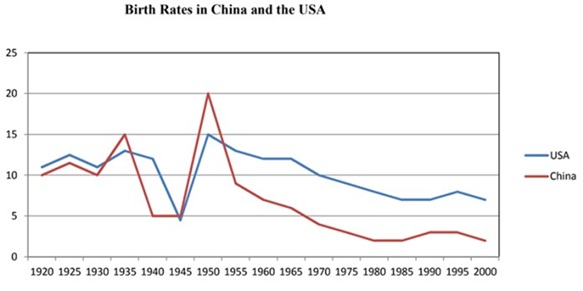
The graph below compares changes in the birth rates of China and the USA between 1920 and 2000.
Summarise the information by selecting and reporting the main features, and make comparisons where relevant.
Write at least 150 words.
Ví dụ 1: Tỷ lệ sinh ở Trung Quốc và Mỹ
Bạn nên dành khoảng 20 phút cho bài viết này.
Biểu đồ phía dưới so sánh sự thay đổi về tỷ lệ sinh của Trung Quốc và Mỹ từ năm 1920 đến 2000.
Bạn hãy tổng hợp lại thông tin bằng cách lựa chọn và điểm lại một số nét chính, đưa ra các so sánh nếu cần.
Bài viết ít nhất 150 từ.
Lưu ý:
Trục ngang (X): Thời gian (năm 1920 → 2000)
Trục dọc (Y): Tỷ suất sinh (số trẻ sinh ra trên 1.000 dân)
Đường màu xanh: USA
Đường màu đỏ: China
ĐÁP ÁN:
Biểu đồ đường trên so sánh tỷ lệ sinh ở Trung Quốc và Mỹ đồng thời chỉ ra tỷ lệ này đã thay đổi ra sao từ năm 1920 đến 2000.
Nhìn chung, tỷ lệ sinh của hai quốc gia đều giảm trong khoảng thời gian 80 năm kể trên. Mặc dù cả hai xu hướng đều có nét tương đồng nhau là giảm về tổng thể, tuy nhiên tỷ lệ sinh ở Mỹ trong hầu hết các năm đều cao hơn ở Trung Quốc.
Trong khoảng thời gian từ năm 1920-1935, tỷ lệ sinh ở Mỹ có dao động, mặc dù luôn giữ ở mức trên 10%. Tuy nhiên, ở thập kỷ tiếp theo, tỷ lệ sinh ở Mỹ đã giảm mạnh xuống dưới 5%. Trong những năm 1950, con số này lại tăng đột biến tới 15%, cao nhất trong khoảng thời gian 80 năm. Trong những năm tiếp theo, tỷ lệ sinh ở Mỹ có xu hướng giảm dần, và đạt mức 7% trước năm 2000.
Cùng giai đoạn trên, tỷ lệ sinh ở Trung Quốc thay đổi mạnh hơn ở Mỹ. Tỷ lệ này giảm xuống 5% từ năm 1940 đến năm 1945 trước khi đạt cực đại 20% trong cả biểu đồ vào năm 1950. Trái lại, 5 năm sau đó, tỷ lệ sinh ở Trung Quốc đã giảm mạnh hơn 10%, và chỉ đạt xấp xỉ 2% vào năm 2000.
ANSWER:
The line graph compares birth rates in China and the US and how these rates changed from 1920 to 2000
Overall, the birth rates of both nations decreased over the period of 80 years. Although the two trends were similar in terms of a general decline, the birth rate of the USA in most years was higher than that of China.
In the 1920-1935 period, the birth rate in America fluctuated, although it always remained above 10%. However, in the following decade, the American birth rate fell sharply to below 5%. In the 1950s, the figure for the USA increased significantly to exactly 15%, which was its highest point during the 80-year period. Throughout the remainder of the period, there was a gradual decline in the US birth rate, which fell to 7% by the year 2000.
Over the same period, the birth rate in China varied more significantly than in the US. It dropped to 5% from 1940 to 1945 before reaching the highest point of the whole line graph, 20%, in 1950. By contrast, 5 years later, the birth rate in China decreased rapidly by over 10%, falling to approximately 2% in 2000.
Nâng bài viết lên Band 8
The line graph illustrates changes in birth rates in China and the United States between 1920 and 2000.
Overall, both countries experienced a long-term decline in birth rates over the 80-year period. While the general downward trend was similar, the birth rate in the United States was higher than that of China for most of the time span, except for a brief period around the mid-century.
From 1920 to 1935, the American birth rate showed noticeable fluctuations but consistently remained above 10%. This was followed by a sharp decline during the 1940s, when the figure dropped to below 5%. In contrast, the 1950s saw a dramatic rebound, with the US birth rate rising to a peak of approximately 15%, the highest level recorded on the chart. Thereafter, the rate declined steadily, reaching about 7% by the year 2000.
China, by comparison, witnessed far greater volatility. After decreasing to around 5% between 1940 and 1945, the birth rate surged to a peak of 20% in 1950, which was the highest figure on the entire graph. However, this increase was short-lived, as the rate fell sharply over the following decades. By 2000, China’s birth rate had dropped to approximately 2%, significantly lower than that of the United States.
🎯 Vì sao bài này đạt Band 8?
✔ Task Achievement
-
Overview rõ, bao quát xu hướng & so sánh
-
Không sai số liệu, mốc thời gian logic
✔ Lexical Resource (từ vựng)
-
long-term decline, volatility, surged, short-lived, rebound, witnessed
-
Không lặp “birth rate” máy móc
✔ Grammar
-
Câu phức, so sánh nâng cao (by comparison, while, thereafter)
-
Kiểm soát thì & mệnh đề tốt
✔ Coherence & Cohesion
-
Bố cục mạch lạc, liên kết tự nhiên như giám khảo mong đợi