
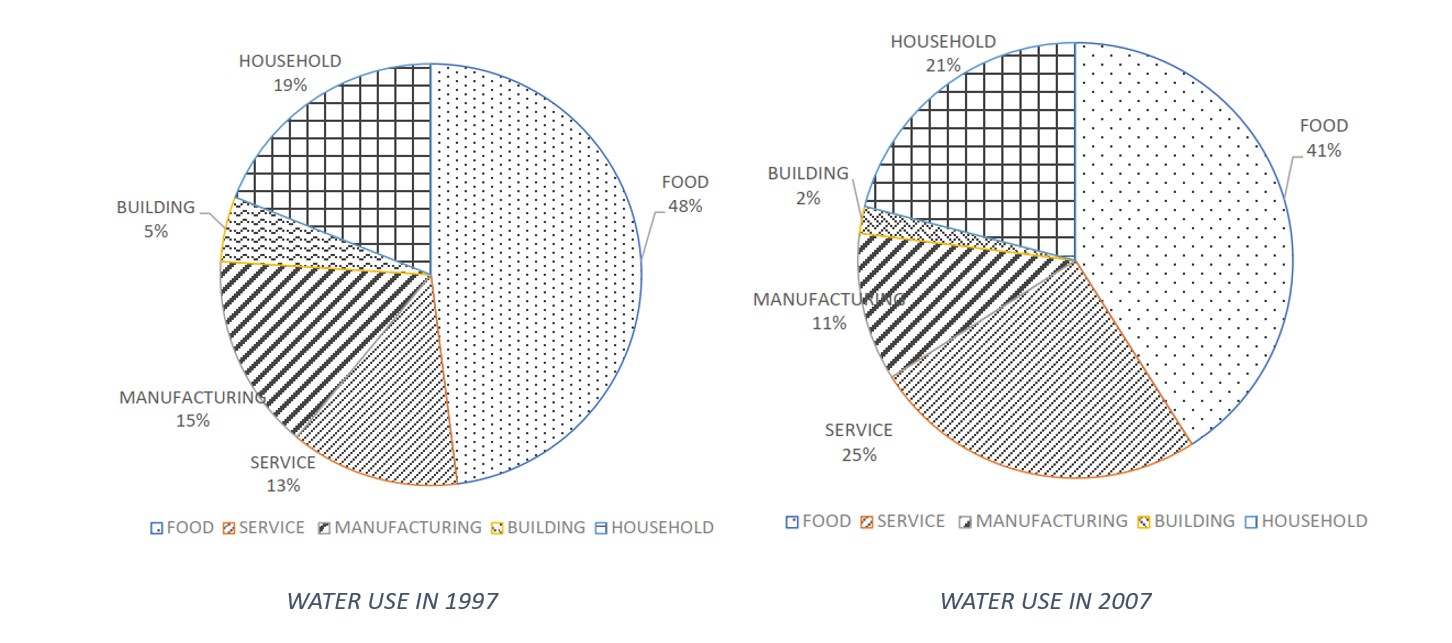
![[Writing Task 1 - Pie Chart] The charts show the total water use in different sectors in Sydney, Australia in 1997 and 2007.](https://hrsviet.com/uploads/0000/1/2026/01/15/pie-water-use-in1007-2007.jpg)
| Band 6.0-6.5 | Band 7.0-7.5 |
|
The pie charts make a clear comparison in terms of how water was distributed in a range of industries in Sydney of Australia between 1997 and 2007. According to the data, it is evident that in 1997, almost one half amount of water (48%) was allocated in food industry, while a collective 47% could be found in the remaining sectors including service, manufacturing and household where water was more equally shared, ranging from 13% to 19%. It is building part that consumed the least proportion of water at merely 5%. A decade later, significant changes had occurred with food industry dropping considerably by 7%, although it still ranked the top. In addition, the water use in building industry and manufacturing industry shared a similar trend during this period of time, they also declined, but only by 3% to and 11% respectively. On the contrary, there was an upward trend in water consumption of household and that of service industry which finally approached 21% and exactly one quarter. Overall, although food industry always played a dominant role in water use, the other parts such as manufacturing and household also had a rising demand. |
The pie charts compare the distribution of water consumption across five sectors in Sydney, Australia, in 1997 and 2007. Overall, the food industry remained the largest consumer of water in both years, despite a noticeable decline over the decade. By contrast, water usage in the household and service sectors increased, while the construction and manufacturing sectors experienced reductions. In 1997, the food industry accounted for almost half of total water consumption, at 48%. The remaining water was shared relatively evenly among the service, manufacturing and household sectors, each using between 13% and 19%. The construction sector consumed the smallest proportion, at just 5%. By 2007, the share of water used by the food industry had fallen by 7 percentage points to 41%, although it still ranked first among all sectors. Similarly, water consumption in construction and manufacturing declined to 2% and 11% respectively. In contrast, household water use rose to 21%, while the service sector recorded the most significant increase, reaching exactly 25% of total consumption. |
❌ Hạn chế
|
✅ Task Achievement
✅ Lexical Resource
✅ Grammar
✅ Coherence & Cohesion
|